Outreach Best Practices
LinkedIn Response Rate Benchmarks: What's a Good Reply Rate in 2026?
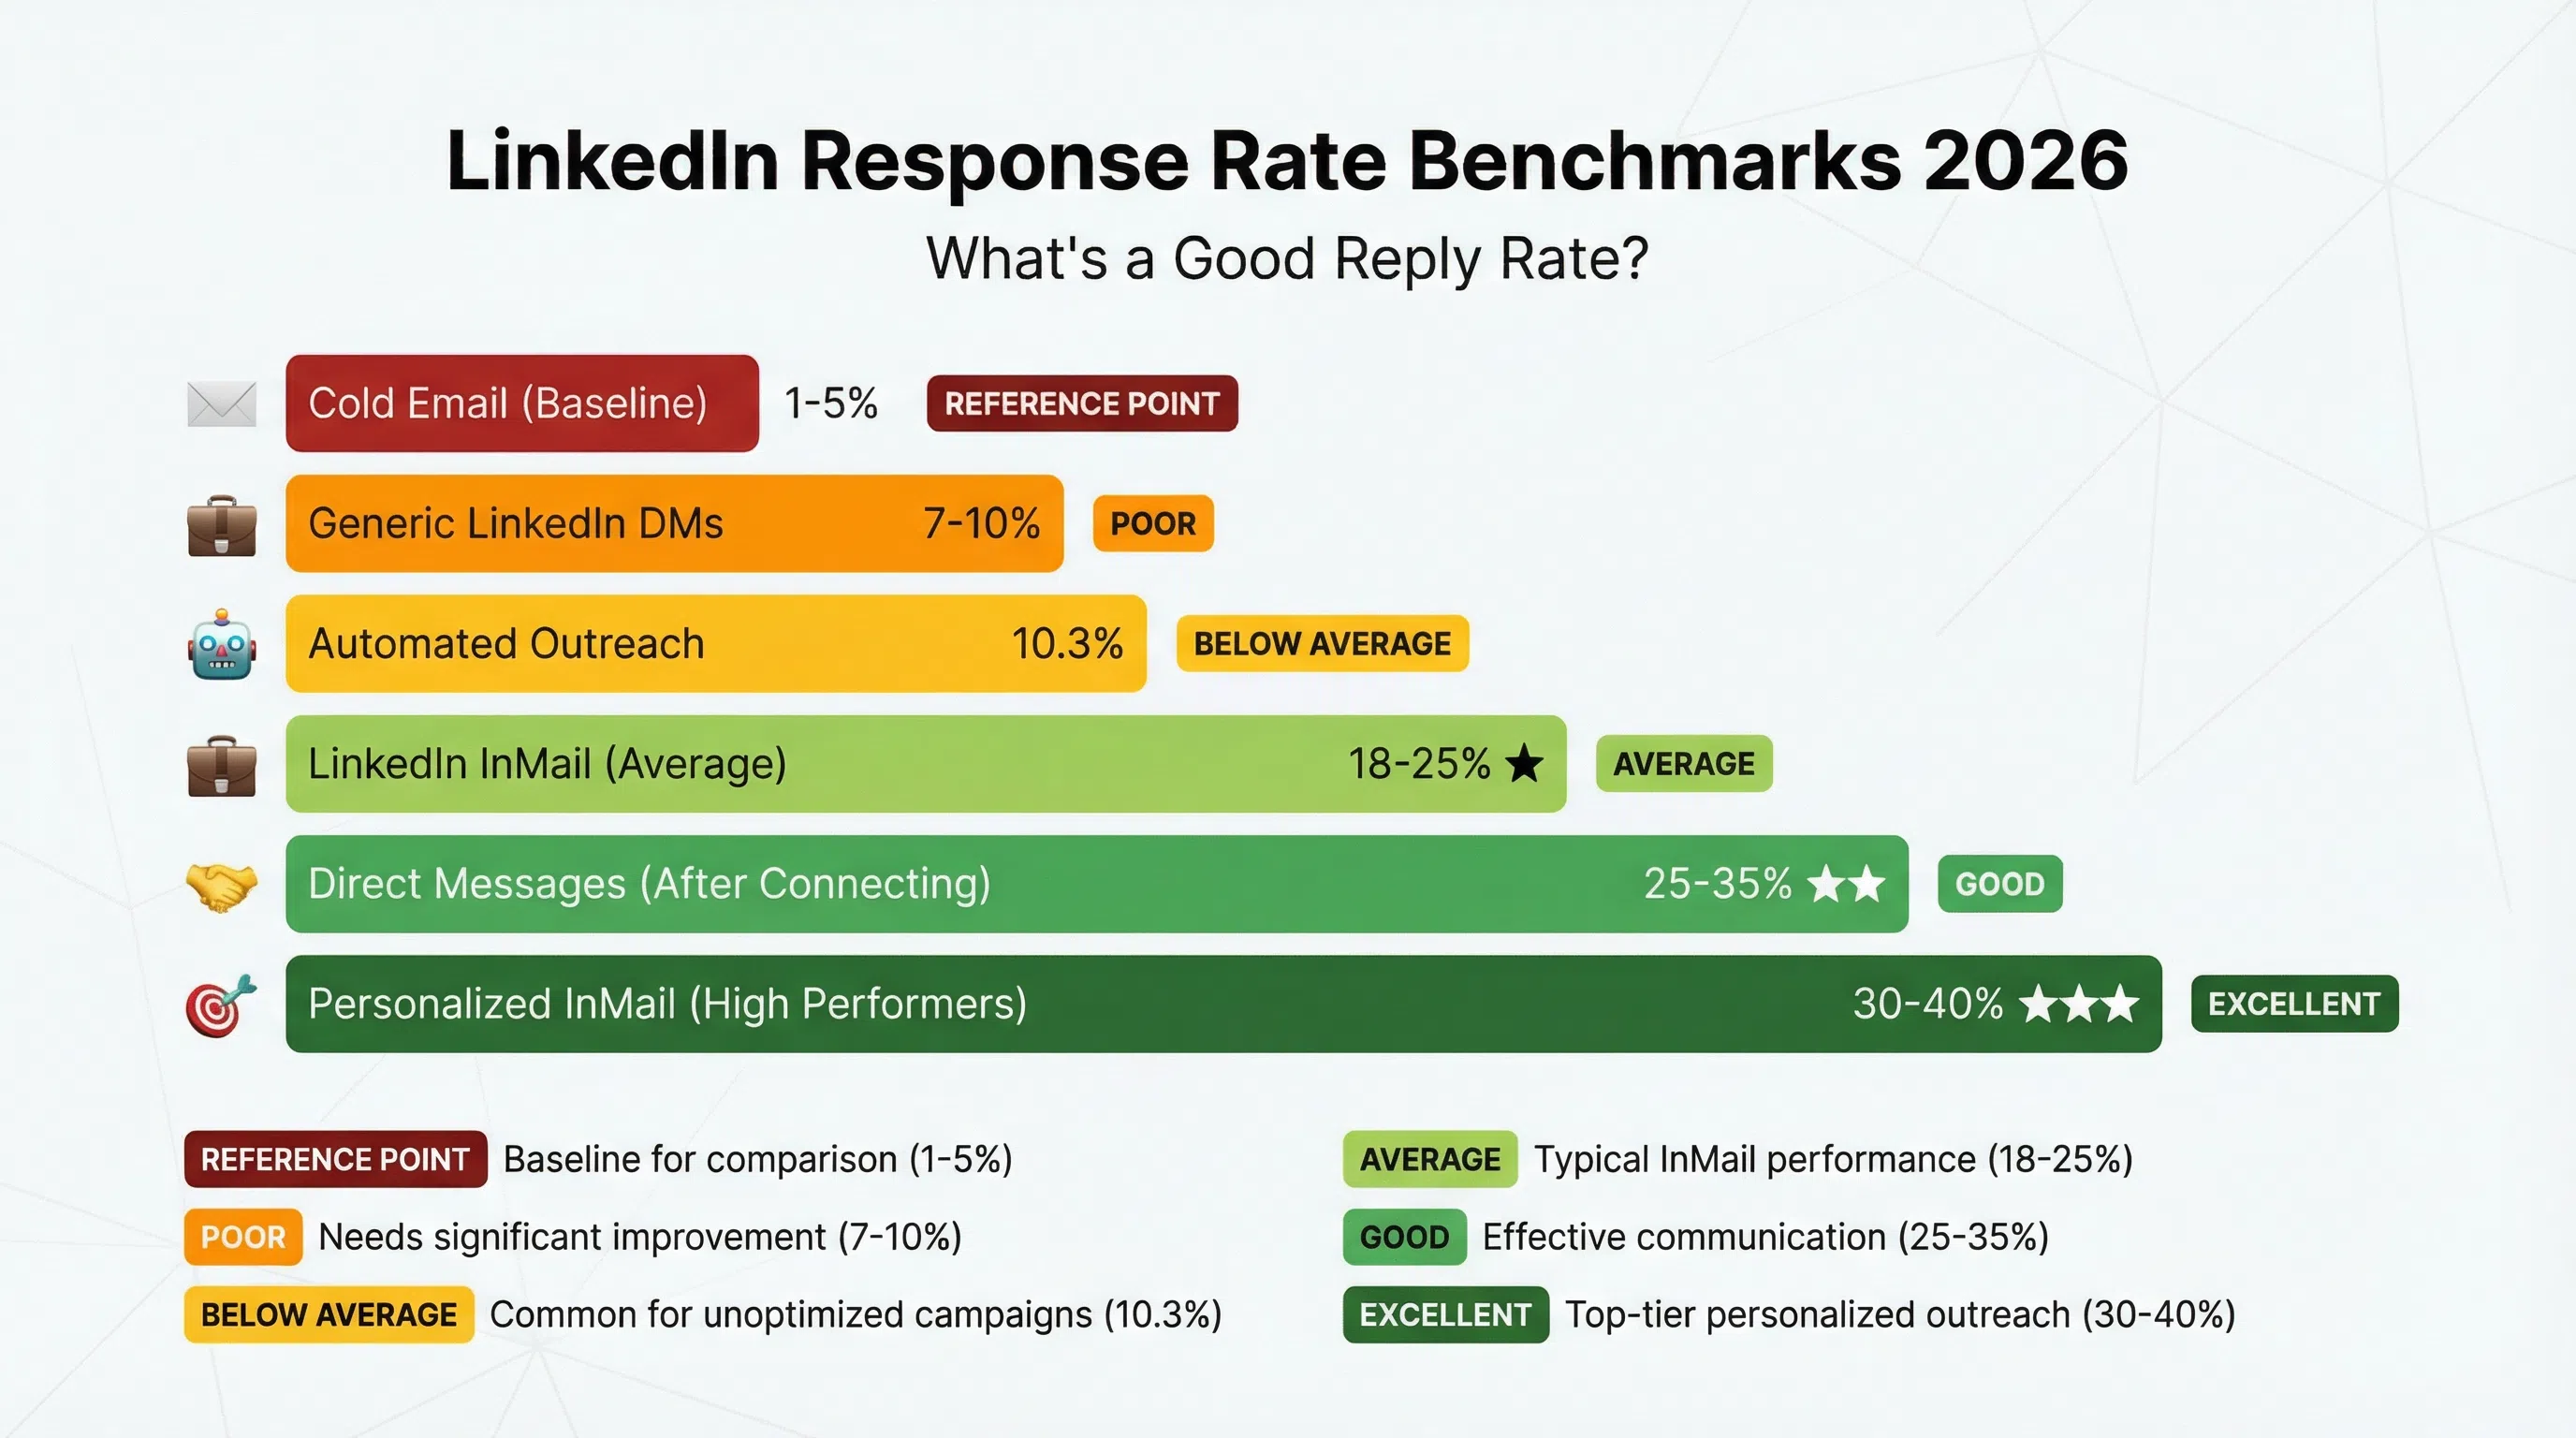
What's a good LinkedIn response rate? Industry benchmarks show 18-25% average, 30-40% for high performers. Learn response rates by industry, role, and how to improve yours.
LeadSpark AI Team
10 min read
If you're doing LinkedIn outreach, you're probably wondering: "Is my response rate good?"
Here's the quick answer: The average LinkedIn InMail response rate is 18-25%—which is 2.6 to 5 times more effective than cold email's 1-5%. High performers hit 30-40%, and elite campaigns break 40%+.
But response rates vary dramatically based on:
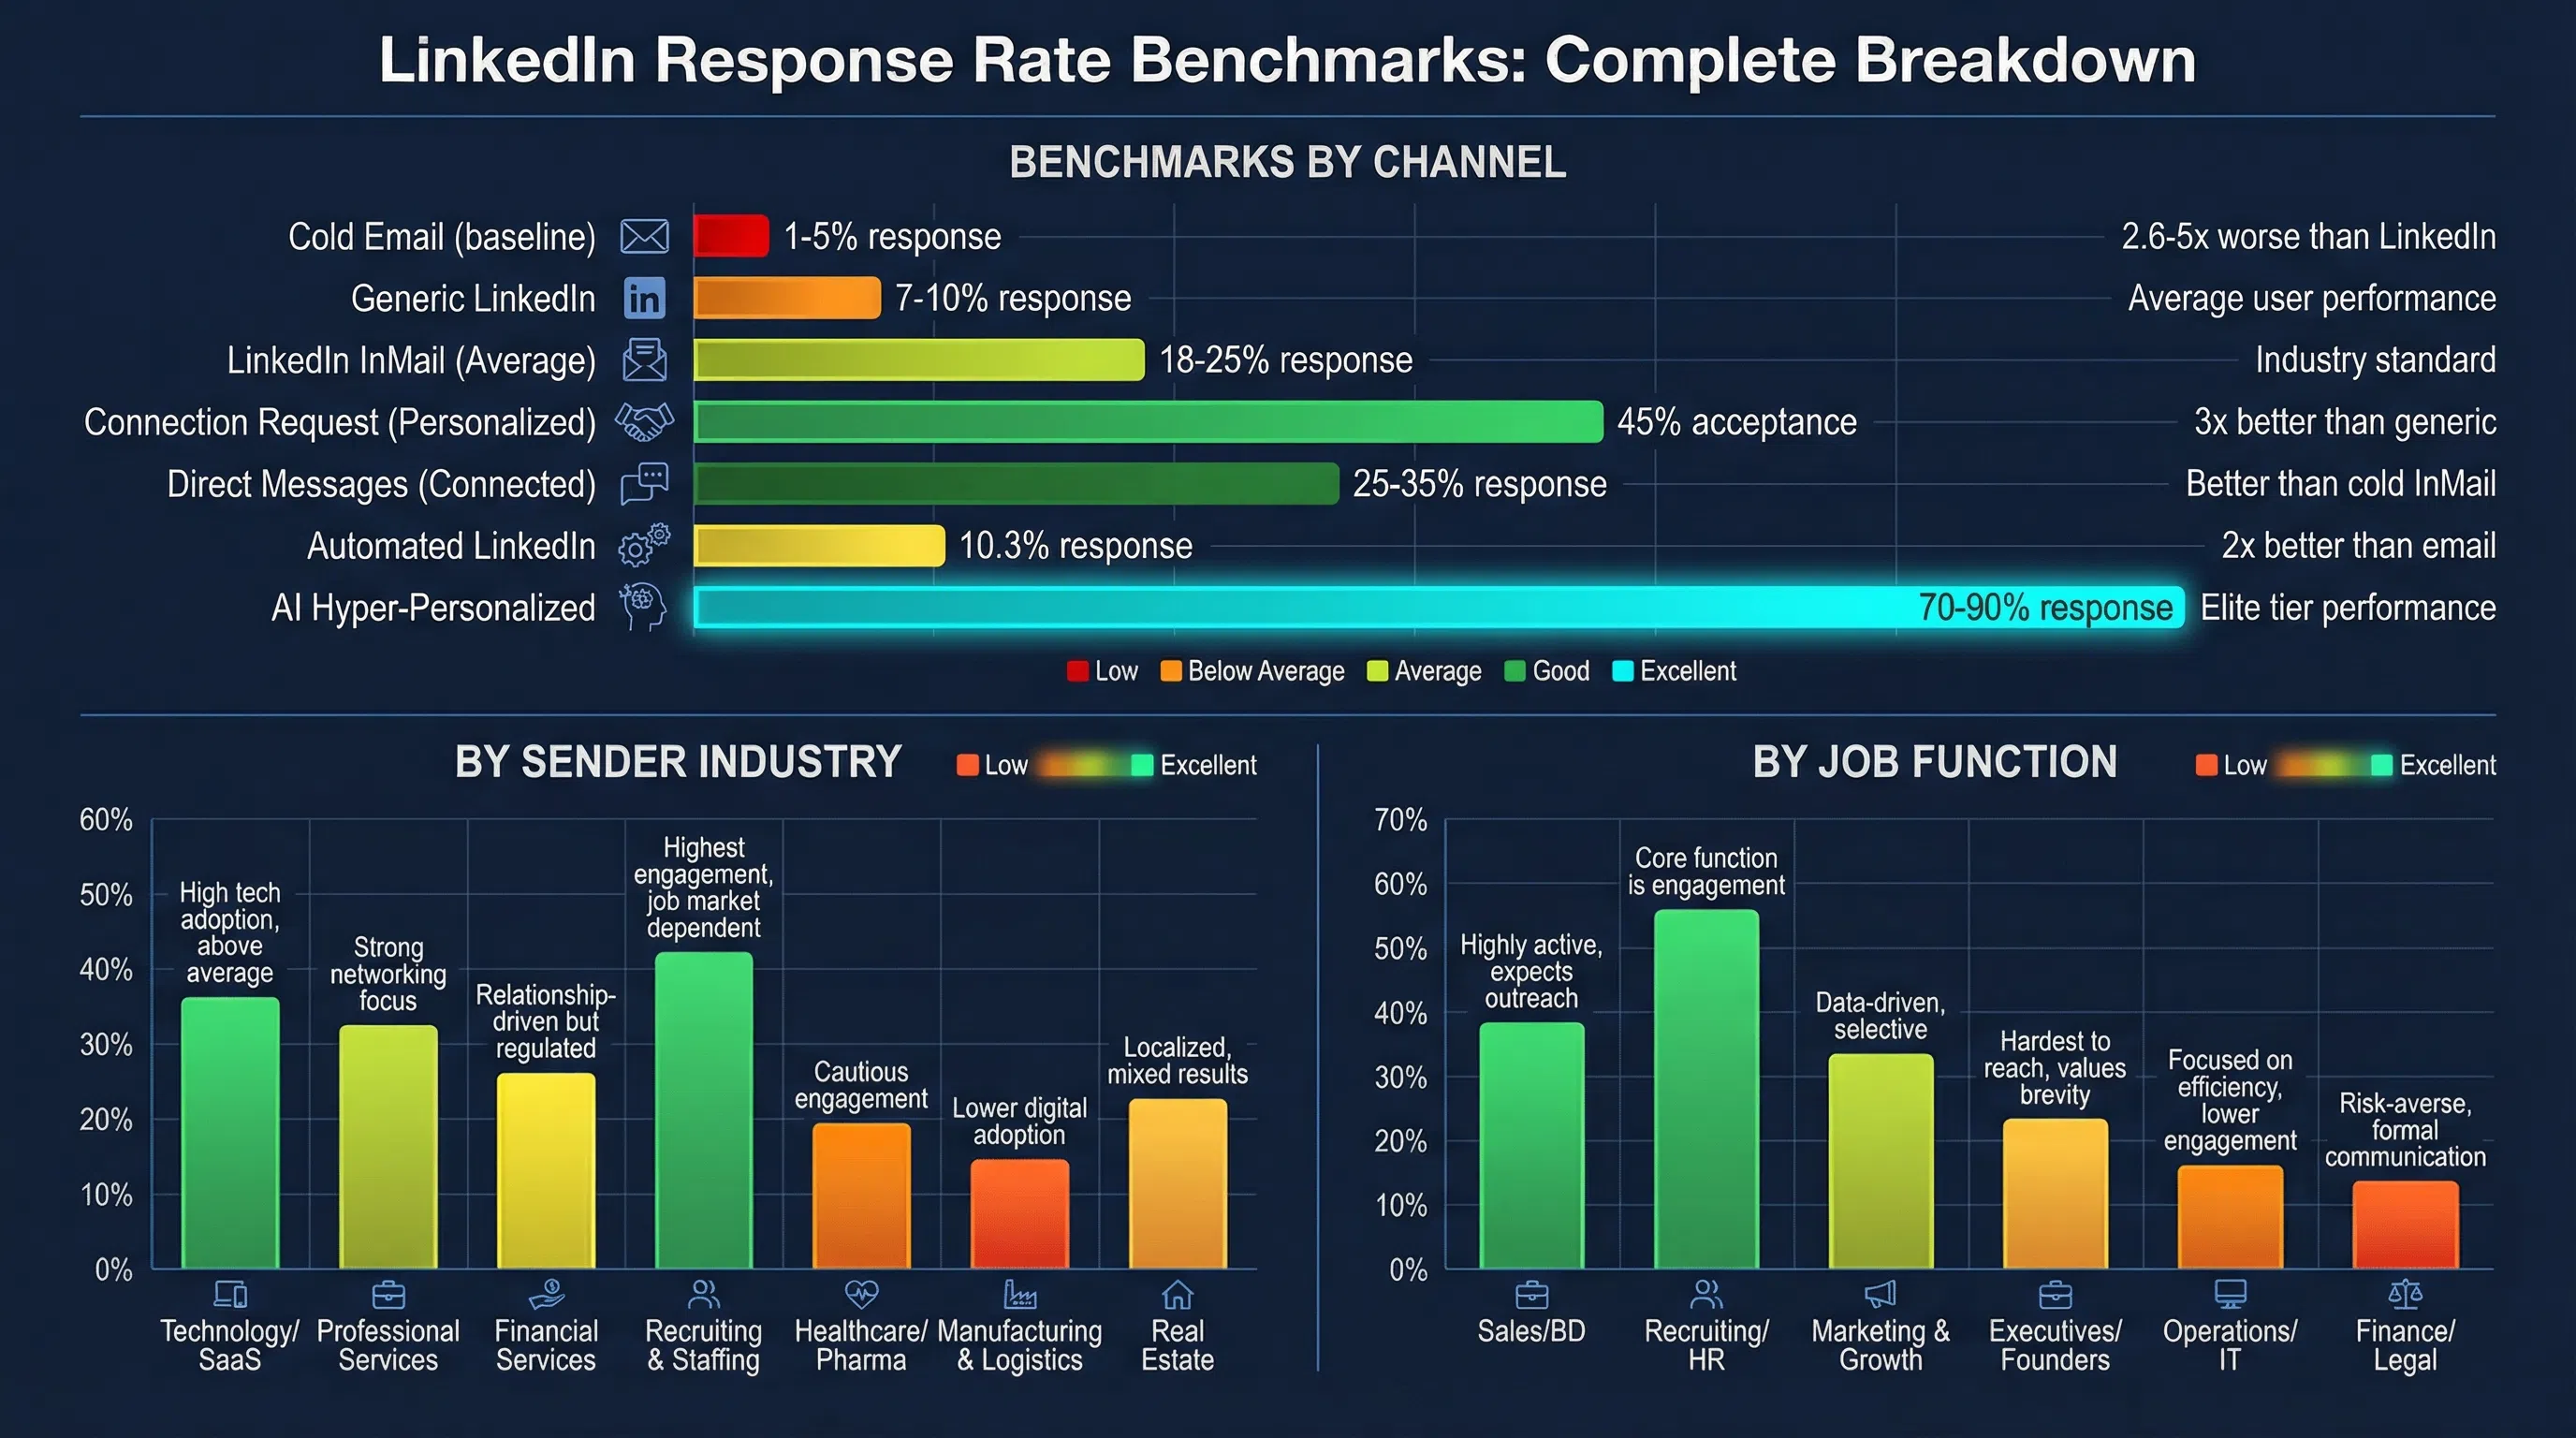
- Channel: InMails (10-25%) vs. connection messages (25-35%) vs. hyper-personalized (70-90%)
- Industry: Legal/Professional Services (10.42%) vs. Software/SaaS (4.77%)
- Role: HR & Talent Acquisition (12.08%) vs. C-Level Executives (6.98%)
- Personalization: Generic messages (7%) vs. personalized (+30% boost)
This benchmark report breaks down LinkedIn response rates by channel, industry, role, and personalization level—plus 8 proven tactics to improve your numbers.
LinkedIn Response Rate Benchmarks by Channel (2026)
Not all LinkedIn outreach is created equal. Response rates vary significantly by channel:
1. LinkedIn InMails: 10-25% Average Response Rate
What it is: Paid messages to people you're not connected with (requires LinkedIn Premium or Sales Navigator)
Benchmarks:
- Average: 18-25% response rate
- High performers: 30-40%
- Elite tier: 40%+
- Poor execution: Below 10%
Why InMails work: InMail is 2.6 to 5 times more effective than cold email. The LinkedIn InMail open rate averages 57.5%, up to 85%—far better than email's 20-30% open rates.
What "good" looks like: If you're getting 25%+ response rates on InMails, you're performing well above average. Anything above 30-40% represents elite performance.
2. Connection Request Messages: 45% Acceptance Rate
What it is: Personalized notes sent with connection requests (300 character limit)
Benchmarks:
- Personalized requests: ~45% acceptance rate
- Generic requests: ~15% acceptance rate
- Top performers: 45-55% acceptance rate
- Average users: 15-20% acceptance rate
Improvement multiplier: Personalized connection requests achieve 3× higher acceptance than generic outreach.
Why it matters: If someone accepts your connection request (45% will), your follow-up message has a 25-35% chance of getting a response—better than cold InMail's 10-25%.
3. Direct Messages (After Connecting): 25-35% Response Rate
What it is: Messages sent to 1st-degree connections
Benchmarks:
- Direct messages to connections: 25-35% response rate
- With personalization: 30-50% response rate
- Strong interest rate: 25-35%
- Average users: Just 7% response rate
Why this works: You've already established a connection. Messages to connections feel less intrusive than cold InMails.
4. Automated LinkedIn Outreach: 10.3% Response Rate
What it is: LinkedIn DMs sent via automation tools
Benchmark: LinkedIn DMs driven by automation achieve an average 10.3% response rate, nearly double that of traditional email outreach.
Trade-off: Automation scales volume but typically sees lower response rates than manual, highly personalized outreach.
5. Hyper-Personalized LinkedIn Outreach (AI-Powered): 70-90% Response Rate
What it is: Messages crafted using AI that analyzes profiles, recent posts, and activity to create context-specific openers
Benchmark: 70-90% response rates with hyper-personalized approaches
Why this works: You're not using templates—you're starting conversations based on what prospects actually care about (recent posts, job changes, company news).
Example: LeadSpark AI analyzes LinkedIn profiles and recent activity to generate personalized conversation starters, achieving response rates 3-4× higher than generic templates.
LinkedIn Response Rate Benchmarks by Industry (2026)
Response rates vary significantly by industry. Here's what the data shows:
Response Rates by Sender Industry (Who's Sending)
Recruiting & HR: 18-25% average response rate — the highest-performing industry for InMail engagement
Legal & Professional Services: 10.42% response rate — the highest among non-recruiting industries
Healthcare: 9.25% — Healthcare professionals are constantly seeking efficiency solutions
Software & SaaS: 4.77% response rate — lowest due to saturation; professionals here are immune to templated messages
Why Software/SaaS Is Hardest
Software & SaaS sees the lowest response rate (4.77%) because professionals in this space receive dozens of pitches daily. They've developed "template blindness"—they can spot generic outreach instantly and ignore it.
How to break through in SaaS: Reference specific product launches, technical blog posts, or GitHub activity. Show you've done deep research.
Response Rates by Recipient Job Function (Who's Receiving)
HR & Talent Acquisition: 12.08% response rate — highest by job title since their role involves communicating on LinkedIn. Folks in human resources responded to InMails at a rate 26% higher than the overall average.
Product Management: 10.24%
C-Level Executives: 6.98% response rate — time-poor and inbox-swamped, requiring extremely relevant and brief messages
Sales & Marketing: 6.32-6.40% — they recognize sales tactics instantly
Why C-Level Response Rates Are Low
C-Level executives are time-poor and inbox-swamped. They need extremely relevant and brief messages. Generic pitches get ignored immediately.
How to reach C-Level: Focus on business outcomes (revenue, cost reduction, strategic initiatives), not features. Keep messages under 50 words. Reference board-level concerns.
LinkedIn Response Rate Benchmarks by Personalization Level
Personalization is the single biggest driver of response rate improvement:
Generic Templates: 7% Response Rate
Average users sending generic messages hover around just 7% response rates.
Example of generic:
"Hi [Name], I see you work at [Company]. I'd love to connect about [Topic]."
Basic Personalization: 18-25% Response Rate
The average LinkedIn InMail response rate with basic personalization is 18-25%.
Example of basic personalization:
"Hi [Name], I saw you recently joined [Company] as [Title]. Congrats on the new role!"
Advanced Personalization: 30-40% Response Rate
Example of advanced personalization:
"Hi [Name], I saw your post about [Specific Topic] last week. Your point about [Specific Detail] was spot-on—especially given [Company]'s recent [News/Event]. Have you found any solutions for [Related Challenge]?"
Hyper-Personalization (AI-Powered): 70-90% Response Rate
Hyper-personalized approaches using AI achieve 70-90% response rates by analyzing profiles, recent posts, and activity.
Why it works: You're not just inserting their name—you're demonstrating genuine understanding of their work, challenges, and interests.
Personalization Boost Summary:
- Name + Company: Baseline (7% response)
- Basic personalization: +30% improvement → 18-25% response
- Advanced personalization: +100-200% improvement → 30-40% response
- Hyper-personalization (AI): +900-1200% improvement → 70-90% response
8 Proven Tactics to Improve Your LinkedIn Response Rate
Based on benchmarks and data, here's what actually works:
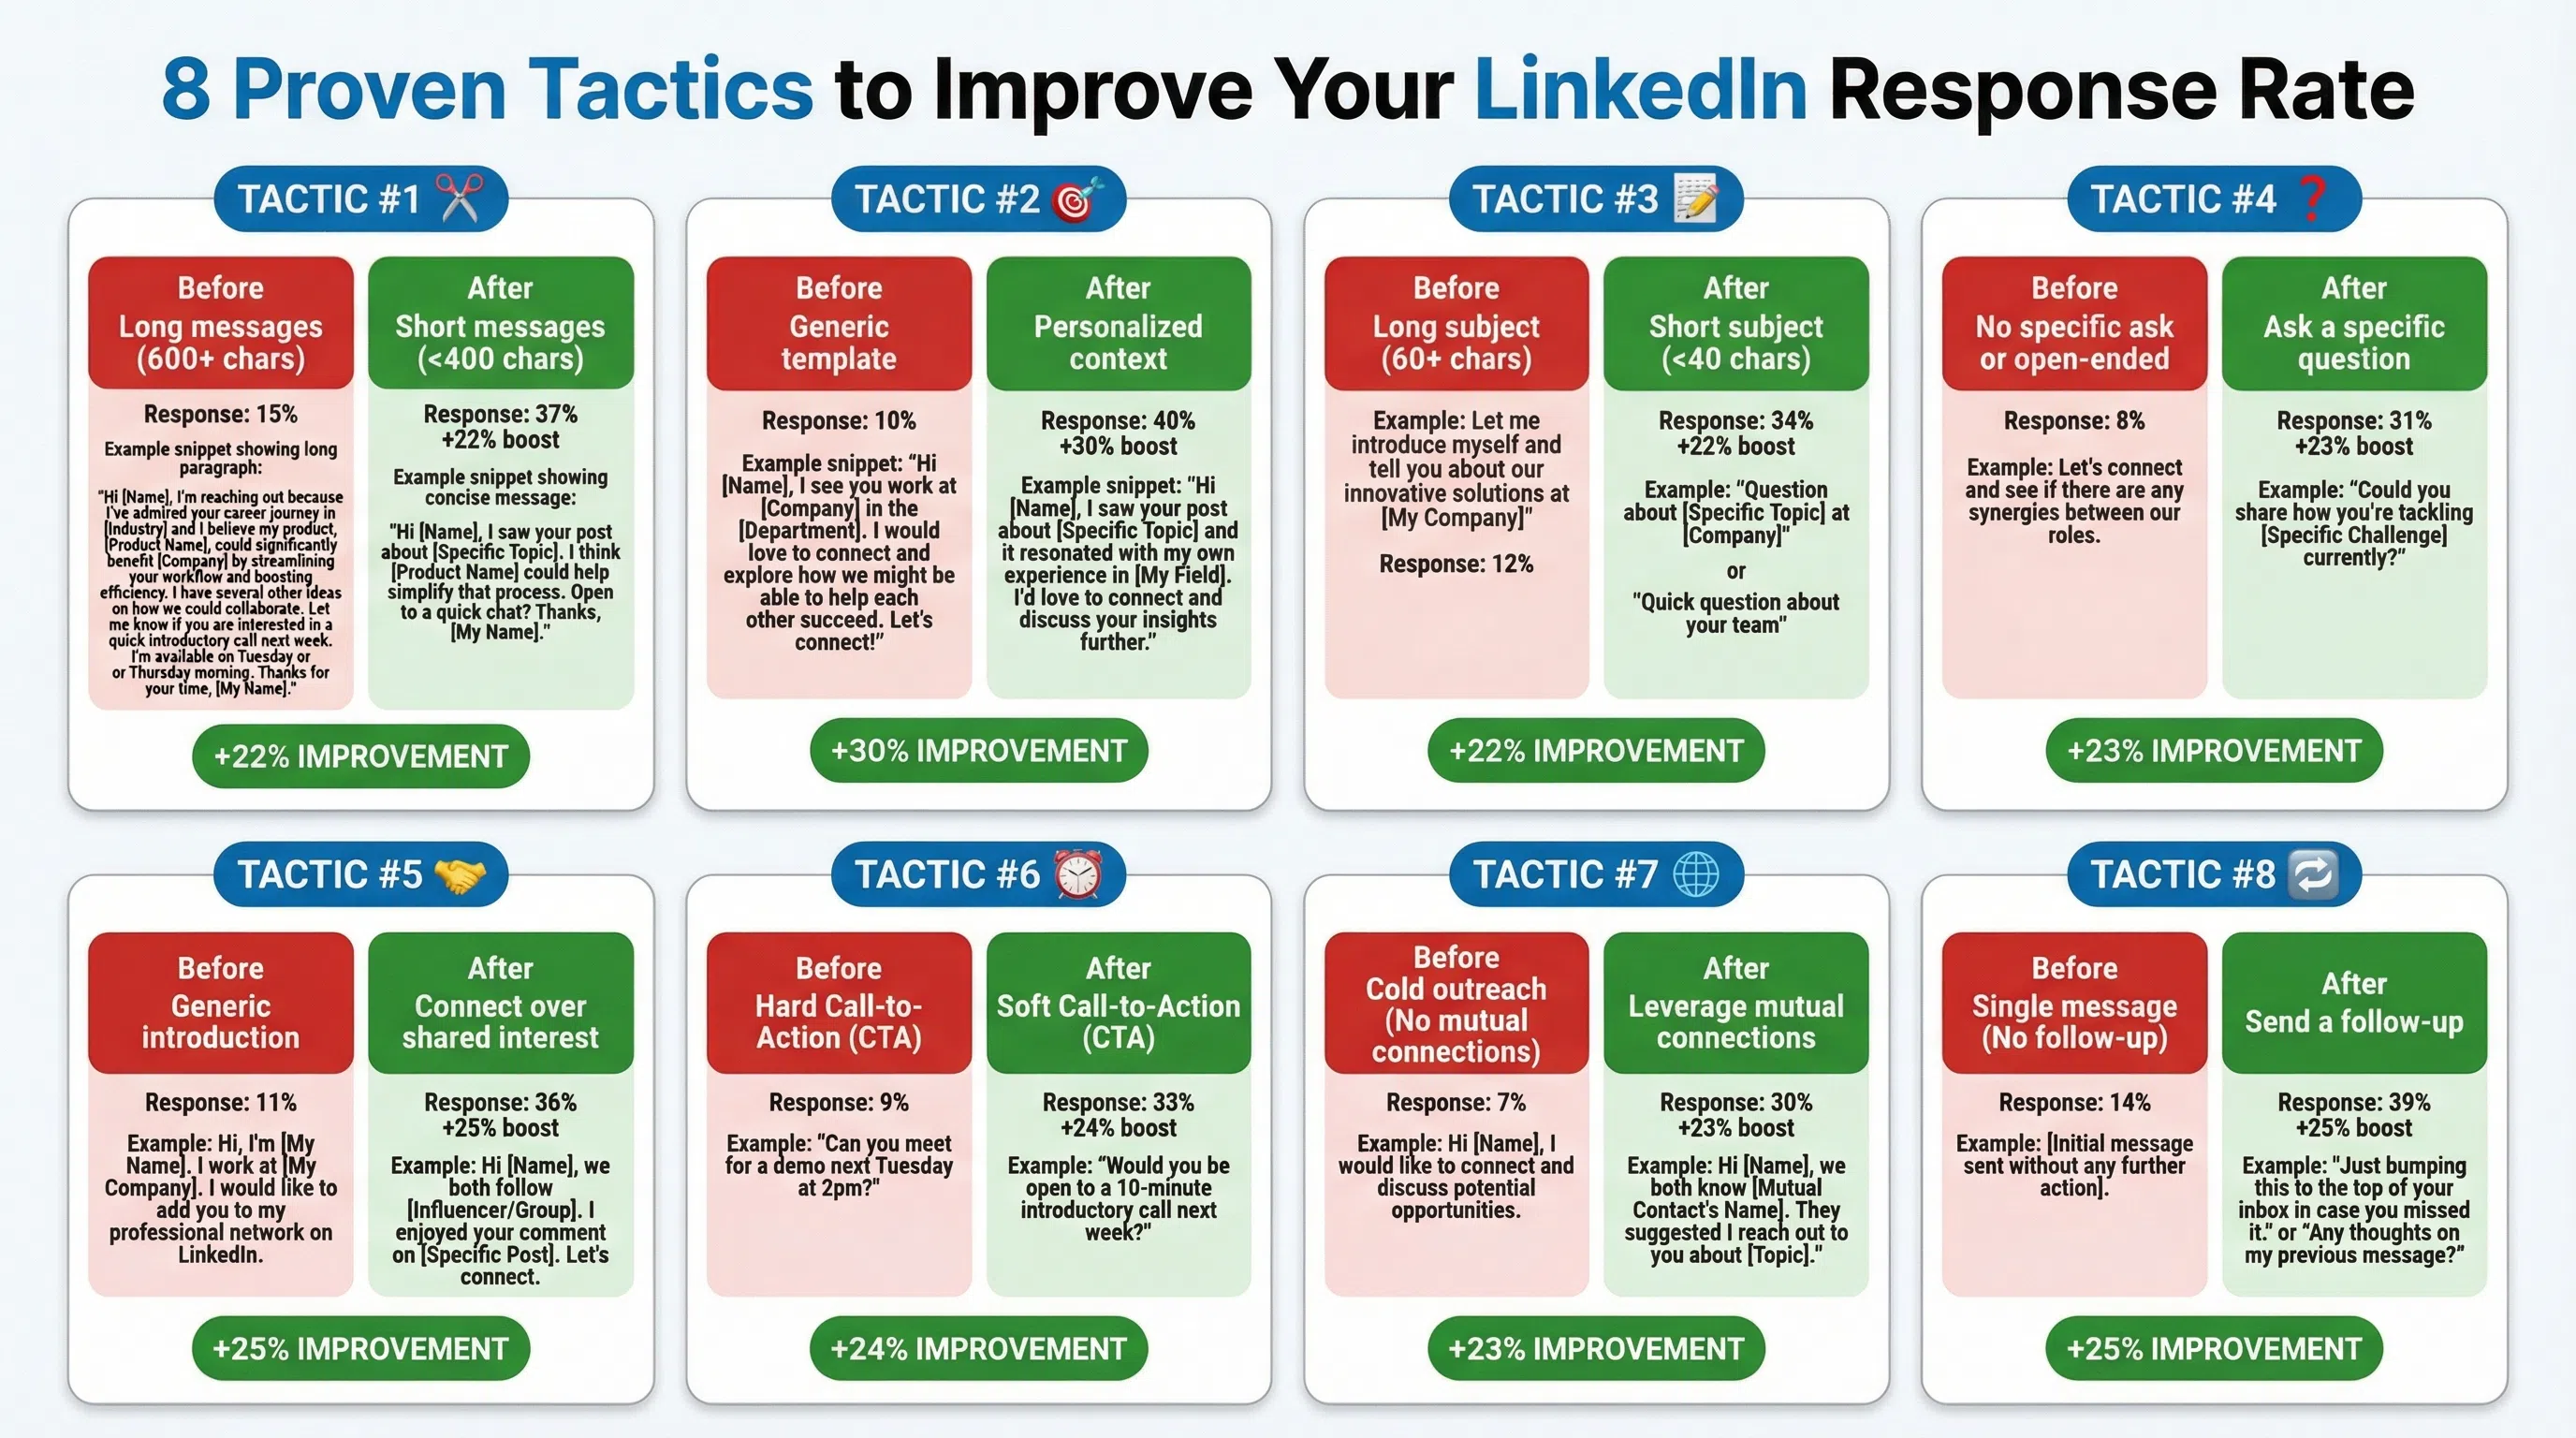
1. Keep Messages Under 400 Characters (+22% Boost)
The response rate for shorter InMails (under 400 characters) is 22% higher than the average.
Why: 57% of LinkedIn traffic comes from mobile. Messages under 400 characters fit on one mobile screen without scrolling.
Optimal length: Around 150 words generally works best. That's roughly 50-100 words for most messages.
2. Personalize Every Message (+30% Boost)
What real personalization looks like:
- Reference their recent LinkedIn post or comment
- Mention shared connections or groups
- Cite a company milestone (funding, product launch, hiring)
- Comment on industry news affecting their company
3. Optimize Subject Lines (25-40 Characters Perform Best)
The best InMail subject lines grab attention by including a business topic relevant to the recipient and/or use a personal touch, with 25 to 40 characters generally performing best.
Strong subject line formulas:
- Question-based: "Quick question about [Specific Topic]"
- Referral-based: "[Mutual Connection] suggested I reach out"
- Value-based: "Thought this would help with [Challenge]"
- Curiosity-based: "How [Similar Company] solved [Problem]"
4. Send at Optimal Times (+15-20% Improvement)
Best days: Tuesday (6.90%) and Thursday (6.85%) show highest reply rates
Best times: 8-10 AM (morning coffee scroll) and 5-6 PM (commute time on mobile)
Worst day: Most prospects respond least on Saturday
5. Warm Up Prospects Before InMailing (+27% Boost)
Warm-up tactics:
- Like and comment on their posts (2-3 times over 1-2 weeks)
- Engage with their content before reaching out
- Join the same LinkedIn groups
6. Send Personalized Connection Requests First (3× Higher Acceptance)
Then, if someone accepts your connection request (45% will), your follow-up message has a 25-35% chance of getting a response—better than cold InMail's 10-25%.
Strategy: Connect first with a personalized note, then message after they accept. Your response rate will be 2-3× higher than cold InMails.
7. Use AI for Personalization at Scale
Manual personalization doesn't scale beyond 10-20 prospects per day. AI/automation are saving SDRs hours and boosting reply rates (e.g., LinkedIn message response ~10.3% vs typical ~5%).
However: Basic automation (10.3% response) < Manual personalization (25-35%) < AI hyper-personalization (70-90%)
The key is using AI that actually personalizes based on context (recent posts, job changes, company news)—not just templates with name insertion.
8. Follow Up 2-3 Times (But Space Them Out)
Best practice: 2 to 3 follow-up messages spaced out over a week or two. Make each one value-based.
Follow-up schedule:
- First message: Value-first opener
- Follow-up 1 (3-5 days): Gentle reminder or new resource
- Follow-up 2 (7-10 days): Different angle or question
- Follow-up 3 (14+ days): Breakup message ("I'll stop bugging you...")
Don't send more than 3 follow-ups—it looks desperate.
LinkedIn vs. Other Channels: Response Rate Comparison
How does LinkedIn stack up against other outreach channels?
LinkedIn InMail vs. Cold Email
LinkedIn InMail: 18-25% average
Cold Email: 1-5% average
Winner: LinkedIn InMail is 2.6 to 5 times more effective than cold email
Why LinkedIn wins: Higher open rates (57.5% vs. 20-30%), less spam competition, professional context, visible sender profiles.
LinkedIn Messages vs. Automated LinkedIn DMs
Manual LinkedIn messages: 25-35% response
Automated LinkedIn DMs: 10.3% response
Winner: Manual messages (2-3× better)
Trade-off: Manual = higher quality but lower volume. Automation = higher volume but lower quality.
LinkedIn InMail vs. LinkedIn Connection Messages
Cold InMail: 18-25% response
Message after connecting: 25-35% response
Winner: Connection messages (25-50% better)
Strategy: Connect first (45% acceptance with personalized requests), then message. Your overall conversion will be higher than cold InMails.
LinkedIn vs. Phone Calls
LinkedIn InMail: 18-25% response
Cold calling: 2-5% connection rate, <2% conversion to meeting
Winner: LinkedIn (3-5× better)
Why: LinkedIn is asynchronous—prospects can respond on their own time. Phone calls interrupt and often go unanswered.
How to Track Your LinkedIn Response Rate
Metrics to Track
- Connection Acceptance Rate: 45% is good, 60%+ is excellent
- InMail Response Rate: 18-25% is average, 30-40% is high performer
- Message Response Rate (1st connections): 25-35% is good, 40%+ is excellent
- Response Time: How quickly prospects reply (faster = higher interest)
- Meeting Conversion: % of responses that turn into meetings
How to Calculate Response Rate
Formula:
`
Response Rate = (Total Responses ÷ Total Messages Sent) × 100
`
Example:
- Sent 100 InMails
- Received 23 responses
- Response Rate = (23 ÷ 100) × 100 = 23% (good!)
What to Aim For
- InMails: 20%+ is good, 30%+ is excellent
- Connection acceptance: 40%+ is good, 60%+ is excellent
- Messages to connections: 30%+ is good, 45%+ is excellent
Common LinkedIn Response Rate Mistakes
Mistake 1: Comparing Apples to Oranges
Don't compare cold InMail response rates (18-25%) to connection message response rates (25-35%). They're different channels with different benchmarks.
Mistake 2: Not Segmenting by Industry
If you're selling to Software/SaaS companies, a 10% InMail response rate might be good (industry average is 4.77%). But if you're in Legal/Professional Services, 10% would be below average (industry average is 10.42%).
Mistake 3: Ignoring Open Rates
The LinkedIn InMail open rate averages 57.5%, up to 85%. If your messages are getting opened but not replied to, the problem is your message content—not your targeting.
Mistake 4: Giving Up Too Soon
Best practice: 2 to 3 follow-up messages spaced out over a week or two. Many SDRs send one message and give up. Follow-ups can double your response rate.
Mistake 5: Optimizing for Volume Over Quality
Sending 500 generic InMails with a 5% response rate (25 responses) is worse than sending 100 personalized messages with a 30% response rate (30 responses).
Better strategy: Lower volume, higher personalization, better targeting.
FAQs
What is a good LinkedIn InMail response rate?
The average LinkedIn InMail response rate is 18-25%. A good response rate is 25%+, and high performers consistently hit 30-40%. If you're below 15%, focus on personalization and message length (under 400 characters).
What is a good LinkedIn connection request acceptance rate?
Personalized connection requests achieve ~45% acceptance rates, while generic requests only get ~15% acceptance. A high acceptance rate (40%+ is good, 60%+ is excellent) signals that you're connecting with relevant people who want to network with you.
Is LinkedIn better than cold email for response rates?
Yes. LinkedIn InMail is 2.6 to 5 times more effective than cold email. LinkedIn InMails average 18-25% response rates vs. cold email's 1-5%. The LinkedIn InMail open rate averages 57.5%, up to 85%, compared to email's 20-30%.
Why is my LinkedIn response rate so low?
Common reasons: 1) Messages are too long—keep under 400 characters for a 22% boost, 2) Lack of personalization—personalized messages get +30% higher response, 3) Wrong timing—send Tuesday-Thursday 8-10am, 4) Generic subject lines—use 25-40 characters, 5) No warm-up—engage with content before messaging for +27% boost.
How can I improve my LinkedIn response rate?
Eight proven tactics: 1) Keep messages under 400 characters (+22%), 2) Personalize every message (+30%), 3) Optimize subject lines to 25-40 characters, 4) Send Tuesday/Thursday 8-10am, 5) Warm up prospects first (+27%), 6) Use personalized connection requests (3× higher acceptance), 7) Use AI for hyper-personalization, 8) Follow up 2-3 times.
Should I use automated LinkedIn outreach?
LinkedIn DMs driven by automation achieve an average 10.3% response rate, which is better than cold email but worse than manual LinkedIn messages (25-35%). Use automation for volume but expect lower quality. Better: use AI that personalizes based on context (70-90% response rates) rather than generic templates.
What LinkedIn response rate should I aim for by role?
HR & Talent Acquisition: 12.08%+ is good
Product Management: 10.24%+ is good
C-Level Executives: 6.98%+ is good (they're hardest to reach)
Sales & Marketing: 6.32-6.40%+ is good
C-Level executives are time-poor and inbox-swamped, requiring extremely relevant and brief messages. Adjust your expectations by role.
How do I calculate my LinkedIn response rate?
Formula: (Total Responses ÷ Total Messages Sent) × 100
Example: If you sent 100 messages and got 23 responses, your response rate is 23%. Track separately for InMails, connection requests, and direct messages since benchmarks differ by channel.
Benchmark Your LinkedIn Response Rate
The data is clear: 18-25% is average, 30-40% is high performer, and 70-90% is elite tier with hyper-personalization.
Key takeaways:
- LinkedIn outperforms email: 2.6-5× better response rates
- Personalization is everything: +30% boost with basic personalization, 70-90% with AI
- Connect first, message second: 45% accept personalized requests, then 25-35% respond to messages
- Keep it short: Under 400 characters = +22% response
- Timing matters: Tuesday/Thursday 8-10am perform best
If you're stuck at 10-15% response rates, the problem isn't LinkedIn—it's your personalization strategy. Try LeadSpark AI to analyze LinkedIn profiles and recent posts, then generate hyper-personalized conversation starters that achieve 70-90% response rates—not by using templates, but by understanding what each prospect actually cares about.
Sources:
- LinkedIn InMail Response Rate Stats 2026 - Sales So
- LinkedIn InMail Statistics 2026 - Sales So
- LinkedIn Messaging Benchmarks 2025 - Alsona
- 2026 LinkedIn Outreach Stats - SalesBread
- LinkedIn Statistics 2026 - Martal
- How InMail Response Rates Compare - LinkedIn Business
- How to Increase LinkedIn Connection Acceptance Rate - Gracker
- LinkedIn Outreach Benchmarks - LeadLoft
- 5 Steps to Increase LinkedIn Message Response Rates - Surfe
- How to Improve Your InMail Response Rate - LinkedIn
Ready to Generate Personalized Icebreakers?
Join sales professionals using LeadSpark AI to create hyper-personalized LinkedIn icebreakers in minutes.